Cyclistic Data Analysis Case Study

Introduction
Welcome to my Google Data Analytics Case Study.
My name is Hugo and in this project, I will take on the role of a Junior Data Analyst on the marketing analytics team at a fictional bike-share company based in Chicago. The objective of this case study is to analyze historical trip data to identify behavioral differences between casual riders and annual members. These insights will inform the development of a targeted marketing strategy aimed at converting casual riders into annual members, thereby increasing the company’s overall revenue.
The analysis will be conducted using SQL, and Tableau, and will follow Google’s six-step data analysis process: Ask, Prepare, Process, Analyze, Share, and Act.
Scenario
You are a junior data analyst working on the marketing analyst team at Cyclistic, a bike-share company in Chicago. The director of marketing believes the company’s future success depends on maximizing the number of annual memberships. Therefore, your team wants to understand how casual riders and annual members use Cyclistic bikes differently. From these insights, your team will design a new marketing strategy to convert casual riders into annual members. But first, Cyclistic executives must approve your recommendations, so they must be backed up with compelling data insights and professional data visualizations.
Deliverables
- A clear statement of the business task.
- A description of all data sources used.
- Documentation of any cleaning or manipulation of data.
- A summary of the analysis.
- Supporting visualizations and key findings.
- Top three recommendations based on the analysis.
Table of Contents
- Ask Phase (Business Task Statement)
- Prepare Phase (Data Sources)
- Process (Data Cleaning & Manipulation)
- Share (Data Visualizations)
- Act
Ask Phase
In the first phase of the analysis my aim is to fully understand the stakeholders expectations, define the problem to be solved and decide which questions to answer in order to solve the problem.
Problem to Solve
- Convert casual riders into annual riders
Question to answer
- How do annual members and casual riders use Cyclistic bikes differently?
Business Task Statement
Identify key usage patterns and behavioral differences between casual riders and annual members of Cyclistic bike-share services, in order to develop targeted marketing strategies that effectively convert more casual riders into annual members, thereby increasing overall revenue and customer retention.
Key Stakeholders
- Cyclistic Executive Team: Responsible for approving the recommended marketing program.
- Lily Moreno: Director of Marketing, responsible for the development of campaigns and initiatives to promote the bike-share program.
Prepare Phase
Key Focus Areas in the Data Preparation Phase
- Identify the Data: Determine what data is required to support the analysis.
- Locate the Data: Identify where the data is stored and how it can be accessed.
- Understand Data Structure: Examine how the data is organized and formatted.
- Assess for Bias and ROCCC: Evaluate the data for potential bias and ensure it meets the ROCCC criteria—Reliable, Original, Comprehensive, Current, and Cited.
- Address Legal and Ethical Considerations: Review licensing, privacy, security, and accessibility requirements related to the data.
- Ensure Data Integrity: Verify the accuracy, consistency, and reliability of the data.
- Identify Data Issues: Detect any errors, anomalies, or quality concerns that may affect the analysis.
Data Source
Cyclistic’s first-party 2024 historical trip data is stored here. The datasets have a different name because Cyclistic is a fictional company. For the purposes of this case study, the datasets are appropriate and will enable me to answer the business questions. The data has been made available by Motivate International Inc. under this license.
Data Overview and Quality Summary
The analysis is based on Cyclistic’s 2024 historical trip data, provided in 12 structured .CSV files organized by rows and columns. Given the record limitations inherent to spreadsheet software, it was not feasible to efficiently execute the processing and analysis phases within those platforms. As a result, the entire workflow was conducted using BigQuery SQL for data processing and Tableau for data visualization.
Although Cyclistic is a fictional company, the data—made available by Motivate International Inc. under an open license—is appropriate for the scope of this case study and supports the business objectives. The data does not present any major or critical issues. Minor issues such as NULL values have been identified and will be addressed during the data cleaning process to ensure integrity and accuracy in analysis.
ROCCC Data Compliance Assessment
- Reliable: The dataset originates from Cyclistic’s internal record systems and consists of historical trip data, minimizing bias as it reflects actual user behavior.
- Original: The data has been directly validated through Cyclistic’s proprietary data collection processes, ensuring authenticity.
- Comprehensive: It includes detailed trip information for both casual riders and annual members throughout the year 2024, with each row representing an individual trip.
- Current: The dataset is up-to-date, covering the year 2024, which aligns with the timeframe of this analysis.
- Cited: The source of the data has been properly referenced for transparency and traceability in the Data Source segment.
Process
In this phase, my primary focus will be on refining the dataset to ensure its quality and reliability. This includes identifying and correcting errors or inaccuracies that could compromise the results. Key tasks will include:
- Cleaning the data to remove inconsistencies
- Transforming the data into a more usable format
- Merging datasets to create a more comprehensive dataset
- Identifying and removing outliers
Once the data has been properly downloaded and stored, I will proceed to extract the contents from the compressed files. All 12 .CSV files will be saved into a dedicated folder.
BigQuery SQL preparation process
- Initiated a new project in BigQuery SQL.
- Due to the large file sizes, a new bucket named
2024_divvy_tripdata_uncleanedwas created to store all original.CSVfiles. - Established a dataset within the project to generate individual data tables corresponding to each of the uncleaned/original
.CSVfiles.
BigQuery SQL Data Cleaning Process
The initial step involved merging all individual data tables into a single consolidated table to facilitate efficient data processing. The subsequent cleaning steps included:
- Standardizing Formatting:
AppliedUPPER,LOWER, orINITCAP(i.e.,PROPER) functions to standardize text formatting across relevant columns. Removed leading and trailing whitespaces using theTRIMfunction. Data types were appropriately cast usingCAST, and the cleaned data was saved into a new table. - Duplicate Check:
Conducted a duplicate check based on the primary key (ride_id). No duplicate records were found. - Null Value Removal:
Identified and removed 1,652,259NULLvalues across all fields. - Primary Key Consistency:
Verified the consistency ofride_idusing theDISTINCTandLENGTH()functions. All IDs had a uniform length of 16 characters, confirming consistency. - Field-Level Validation:
UsedDISTINCTqueries to inspect remaining fields for inconsistencies. - Irrelevant Data Identification:
Detected 47,827 records labeled as electric_scooter under therideable_typefield, which were later removed due to their limited and inconsistent timeframe. - Test Data Removal:
Identified test data in theend_station_idfield.
Exported 1,748 distinct records to Excel for manual review.
Confirmed and removed 35 test records from the dataset. - Geolocation Validation:
Checked latitude and longitude values to ensure they fall within valid geographical ranges.
Preparing Data for Analysis
Once the data was thoroughly cleaned, I proceeded to enhance the data table with additional calculated fields to facilitate analysis.
- Added a new column named
ride_lengthto calculate the duration of each ride in minutes using theDATETIME_DIFFfunction. - Created a
day_of_weekcolumn to extract and store the corresponding weekday from thestarted_atDATETIME field using theFORMAT_DATETIMEfunction. - Introduced a
monthcolumn to identify the month in which each ride began, also utilizing theFORMAT_DATETIMEfunction. - Conducted data mapping verification to ensure all fields were accurately aligned with the original datasets and the defined business requirements.
- The enhanced data was then saved as a new ready to analyze table.
Analysis
In the next phase of the analysis, I will examine the data using calculations and descriptive methods to identify trends and relationships. The goal is to generate insights that will support answering our business question “How do annual members and casual riders use Cyclistic bikes differently?” and addressing key objectives. The following steps were followed:
- Most popular user type.
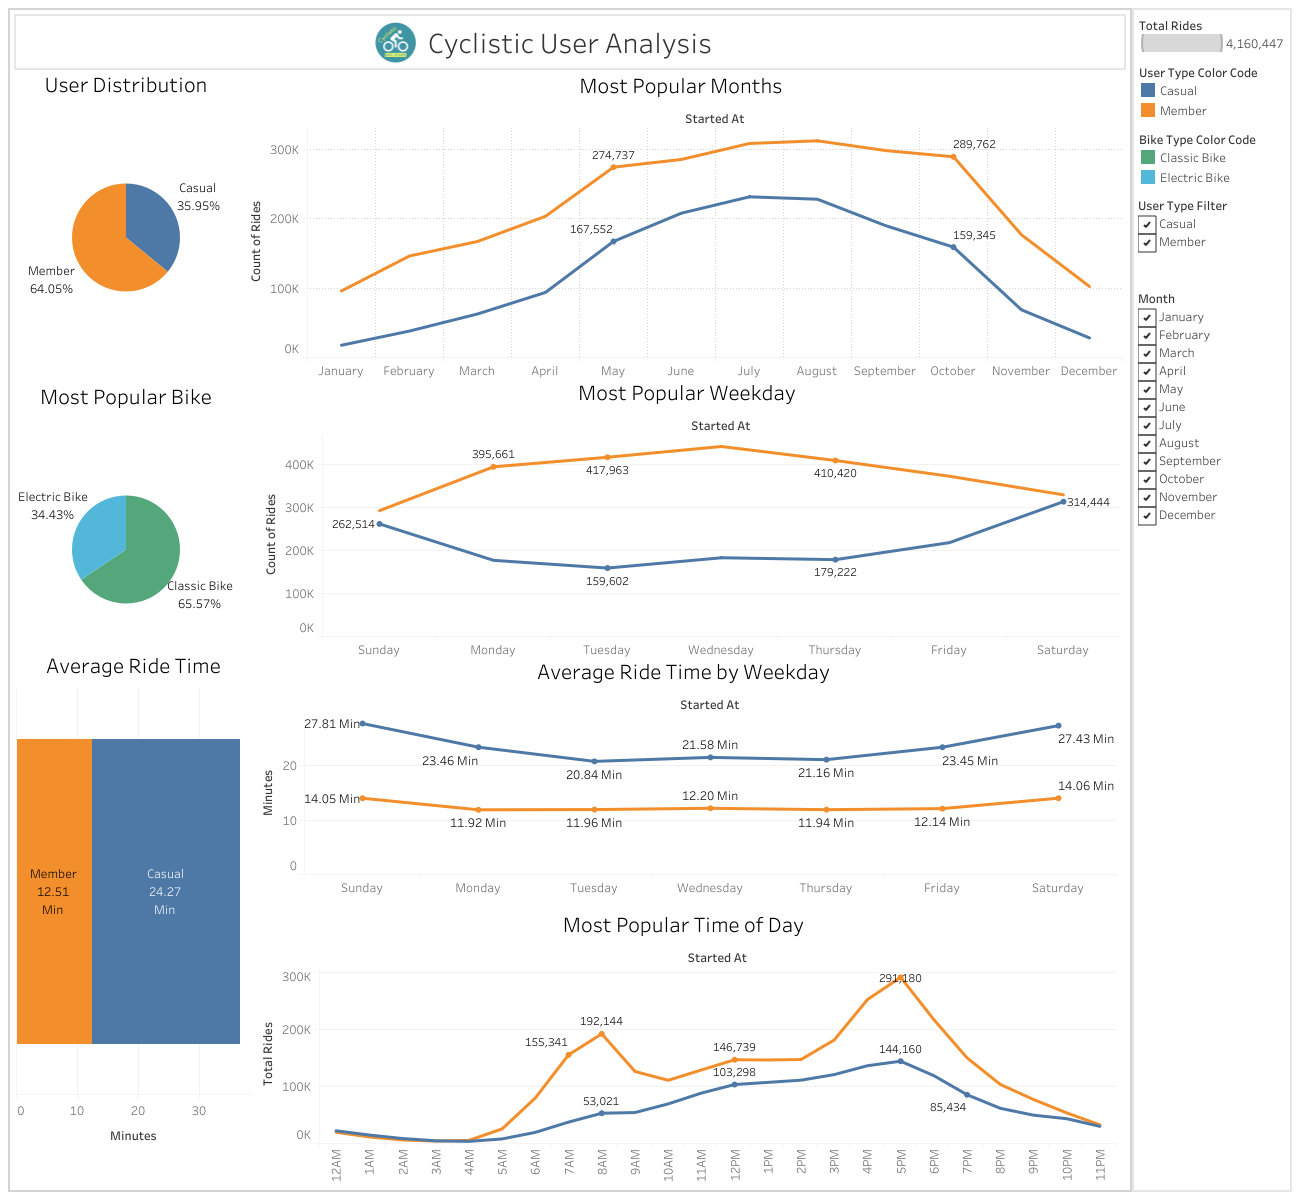
- Member users are the most popular, forming 64% of the total population.
- Most popular type of bike overall.
- Classic bike with 65.5% of preference among users.
- Most popular type of bike per type of user.
- Member users: 66% prefer the Classic bike.
- Casual users: 64.7% prefer the Classic bike.
- Total rides per month by type of user.
- Member users most busy months: July, August, September
- Casual users most busy months: June, July, August
- Percentage of rides per month by type of user.
- User distribution by month.
- Months dominated by member users: December, January, February.
- June, July and August have the highest dominance among Casual users, even though Member users still have dominance between these months.
- Total rides per weekday by type of user.
- Member users’ most busy weekdays: Tuesday, Wednesday, Thursday.
- Casual users most busy weekdays: Friday, Saturday, Sunday.
- Percentage of rides per weekday by type of user.
- User distribution by weekday.
- Weekdays dominated by member users: Tuesday, Wednesday, Thursday.
- Weekdays dominated by casual users: Friday, Saturday, Sunday. Though members still have more dominance over these weekdays.
- Avg ride time by type of user.
- Member users: 12.5 minutes
- Casual users: 24.2 minutes
- Avg ride time by weekday by type of user.
- Weekdays with the longest avg ride length by member users: Saturday, Sunday, Wednesday.
- Weekdays with the longest avg ride length by casual users: Sunday, Saturday, Monday.
- Total rides per hour by type of user.
- Most popular ride times for Members: Between 7am and 6pm
- Most popular ride times for Casual: Between 1pm and 6pm
- Most common and least common start station overall.
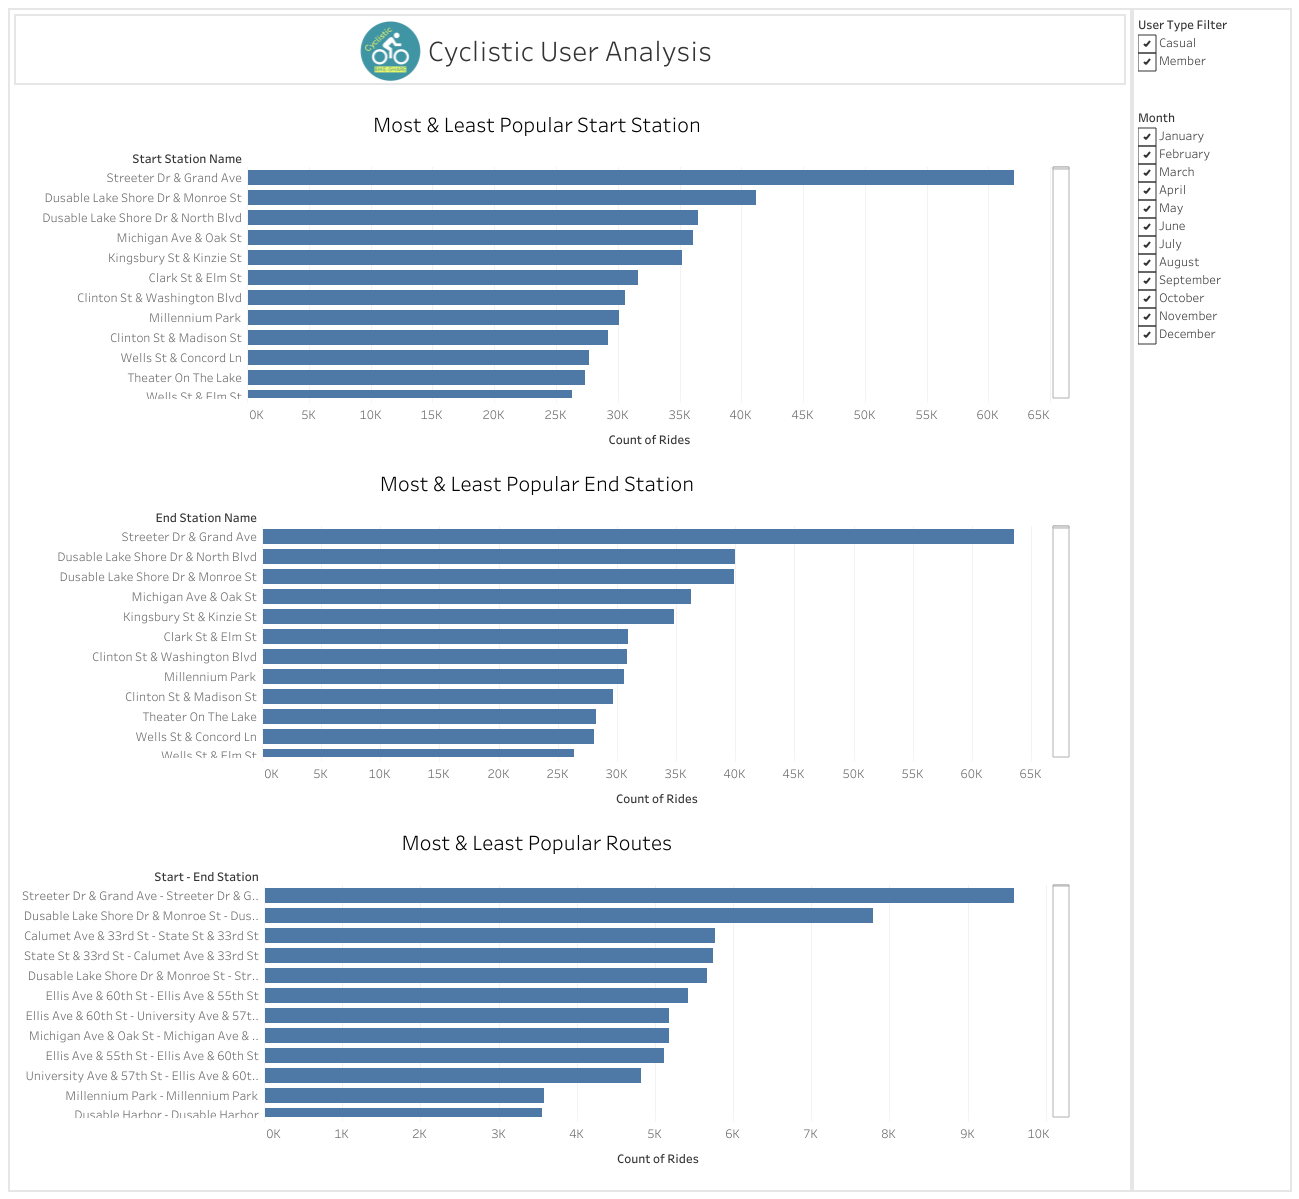
- Most common: Streeter Dr & Grand Ave, Dusable Lake Shore Dr & Monroe St, Dusable Lake Shore Dr & North Blvd.
- Least common: Public Rack - Eggleston Ave & 92nd St, Public Rack - Lowe Ave & 94th St, Public Rack - Longwood Dr & 111th St.
- Most common and least common start station by type of user.
- Member users:
- Most Common: Kingsbury St & Kinzie St, Clinton St & Washington Blvd, Clinton St & Madison St.
- Least Common: Public Rack - Longwood Dr & 111th St, Public Rack - Clyde Ave & 87th St, Public Rack - Oketo & Northwest Hwy.
- Casual users:
- Most Common: Streeter Dr & Grand Ave, Dusable Lake Shore Dr & Monroe St, Michigan Ave & Oak St.
- Least Common: Public Rack - Kolin Ave & Archer Ave, Public Rack - St Louis & 83rd, Public Rack - 2302 S Pulaski Rd.
- Member users:
- Most common and least common end station overall.
- Most Common: Streeter Dr & Grand Ave, Dusable Lake Shore Dr & North Blvd, Dusable Lake Shore Dr & Monroe St.
- Least Common: Public Rack - Cottage Grove Ave & 75th St, Public Rack - Princeton Ave & 99th Pl, Public Rack - Percy Julian Hs.
- Most common and least common end station by type of user.
- Member users:
- Most common: Kingsbury St & Kinzie St, Clinton St & Washington Blvd, Clinton St & Madison St.
- Least common: Halsted St & 123rd St, Public Rack - Mcvicker Ave & Grand Ave, Public Rack - Green St & 103rd St.
- Casual users:
- Most common: Streeter Dr & Grand Ave, Dusable Lake Shore Dr & Monroe St, Dusable Lake Shore Dr & North Blvd.
- Least common: Public Rack - Baltimore Ave & 134th St, Public Rack - Austin Branch Chicago Public Library, Public Rack - Mason Ave & Roosevelt Rd.
- Member users:
- Most common and least common routes overall.
- Most common:
- Streeter Dr & Grand Ave - Streeter Dr & Grand Ave
- Dusable Lake Shore Dr & Monroe St - Dusable Lake Shore Dr & Monroe St
- Calumet Ave & 33rd St - State St & 33rd St
- Least common:
- 900 W Harrison St - Wood St & Augusta Blvd
- 63rd St Beach - State St & 19th St
- 900 W Harrison St - Central Park Ave & Bloomingdale Ave
- Most common:
- Most common and least common routes by type of user.
- Member users:
- Most common:
- State St & 33rd St - Calumet Ave & 33rd St
- Calumet Ave & 33rd St - State St & 33rd St
- Least common:
- 900 W Harrison St - Stave St & Armitage Ave
- 900 W Harrison St - Lake Park Ave & 35th St
- Most common:
- Casual Users:
- Most common:
- Streeter Dr & Grand Ave - Streeter Dr & Grand Ave
- Dusable Lake Shore Dr & Monroe St - Dusable Lake Shore Dr & Monroe St
- Least Common:
- 900 W Harrison St - Central Park Ave & Bloomingdale Ave
- 63rd St Beach - Dorchester Ave & 49th St
- Most common:
- Member users:
Share
After conducting analysis and drawing key insights, I will use Tableau to create clear and impactful data visualizations that effectively communicate my findings and ensure they are accessible and easy to understand. Please click here to access my interactive dashboard and view the data visualizations.
As a reminder, I will quote the business task statement once more here:
“Identify key usage patterns and behavioral differences between casual riders and annual members of Cyclistic bike-share services, in order to develop targeted marketing strategies that effectively convert more casual riders into annual members, thereby increasing overall revenue and customer retention.”
Key Insights
User Segmentation
- Members represent the majority: 64.05% of users are annual members, while 35.95% are casual.
- Classic bikes dominate usage (65.57%) over electric bikes (34.43%), with no split shown by user type.
Behavioral Differences
Monthly Trends:
- Casual riders peak heavily in summer months (May–September), particularly July and August, suggesting they are seasonal/leisure-focused
- Members ride consistently year-round, though they also increase usage in warmer months..
- The monthly trends indicate that bike usage declines during colder months, suggesting that weather has a significant impact. Reducing marketing spend during these low-traffic periods could help optimize the overall budget.
Weekly Usage Patterns
- Casual users are most active during weekends, suggesting they primarily use the service for leisure or tourism, likely indicating they are visitors or tourists.
- Member users are more active on weekdays, implying regular usage for commuting or daily errands, and suggesting they are likely local residents.
Ride Duration
- Casual riders average 24.27 minutes per ride, almost double that of members (12.51 minutes).
- On weekends, casual riders reach up to 27.81 minutes, suggesting leisurely use.
Time of Day
- Casual riders spike at 12 PM, 5 PM, and 6 PM, indicating leisure and evening activity.
- Members peak earlier in the day, notably around 8 AM and 5 PM, aligning with commuting hours.
Station and Route Popularity
- Most popular stations include: Streeter Dr & Grand Ave, DuSable Lake Shore Dr and Millennium Park which are tourist hubs or commuter transition zones.
- Most popular route: Streeter Dr & Grand Ave – Streeter Dr & Grand Ave, suggesting loop rides, common for casual leisure users.
Summary of User Differences
| Feature | Casual Riders | Annual Members |
|---|---|---|
| Usage Frequency | Peaks on weekends | Steady across weekdays |
| Purpose | Leisure/tourism | Commute/daily use |
| Ride Duration | Longer rides (avg. 24.27 min) | Shorter rides (avg. 12.51 min) |
| Seasonality | Summer-heavy | Year-round |
| Time of Day | Midday & evening | Morning & evening commutes |
| Bike Type Preference | Classic bike | Classic bike |
Act
After reviewing the data visualizations and key insights, I’ve developed the following data-driven recommendations to increase the conversion of casual users into annual members.
Recommendations
- Promote annual membership benefits just before and during peak casual usage months (spring/early summer).
- Target casual riders with campaigns highlighting weekday benefits like convenience, time savings, fuel economy, eco-friendly, exercise/workout benefit.
- Emphasize the value of unlimited short trips for members vs. longer rides that can become costly for casual users. Also the greater value over time of annual memberships.
- Run in-app ads or QR codes promoting membership at top tourist stations where casual use is concentrated.
- Position annual plans as ideal for daily commuters and early risers.
- Seasonal Campaigns:
- Offer summer-exclusive membership discounts.
- Highlight savings for frequent users in tourist-heavy months.
- Target casual users with messaging like “Save time and money on your daily commute.”
- Introduce Gaming-like features such as badges, streaks, perks to encourage habitual use.
- Promote electric bike access as a member-only perk if applicable.